Guía 11
Objetivo general
Desarrollar un dashboard interactivo y visualmente intuitivo utilizando tecnologías web modernas, como React, que permita a los usuarios monitorear en tiempo real métricas clave del clima.
Actividades previas
- Desde la línea de comandos:
- Verifique la versión de npm, con:
npm --v
- Verifique la versión de npm, con:
Actividades en clases
Github
- Crea un repositorio en GitHub con el nombre dashboard.
- Incluya el archivo README.md.
- Agregue .gitignore con la plantilla Node.
- Clone su repositorio localmente.
Proyecto Base
-
Desde la línea de comandos,
- Acceda a la carpeta de su proyecto.
cd dashboard- Cree un nuevo sitio con Vite:
npm create vite@latest .- En caso de ser necesario, ingrese y a la instalación del paquete
create-vite:
Need to install the following packages: create-vite@5.5.5 Ok to proceed? (y) y- En caso de ser necesario, seleccione Ignore files and continue a crear la estructura de archivos en un repositorio con README.md:
Current directory is not empty. Please choose how to proceed: » Ignore files and continue- Seleccione React como framework:
√ Select a framework: » React- Seleccione Typescript como variante:
√ Select a variant: » Typescript -
Instale las dependencias
npm install -
Inicie el servidor.
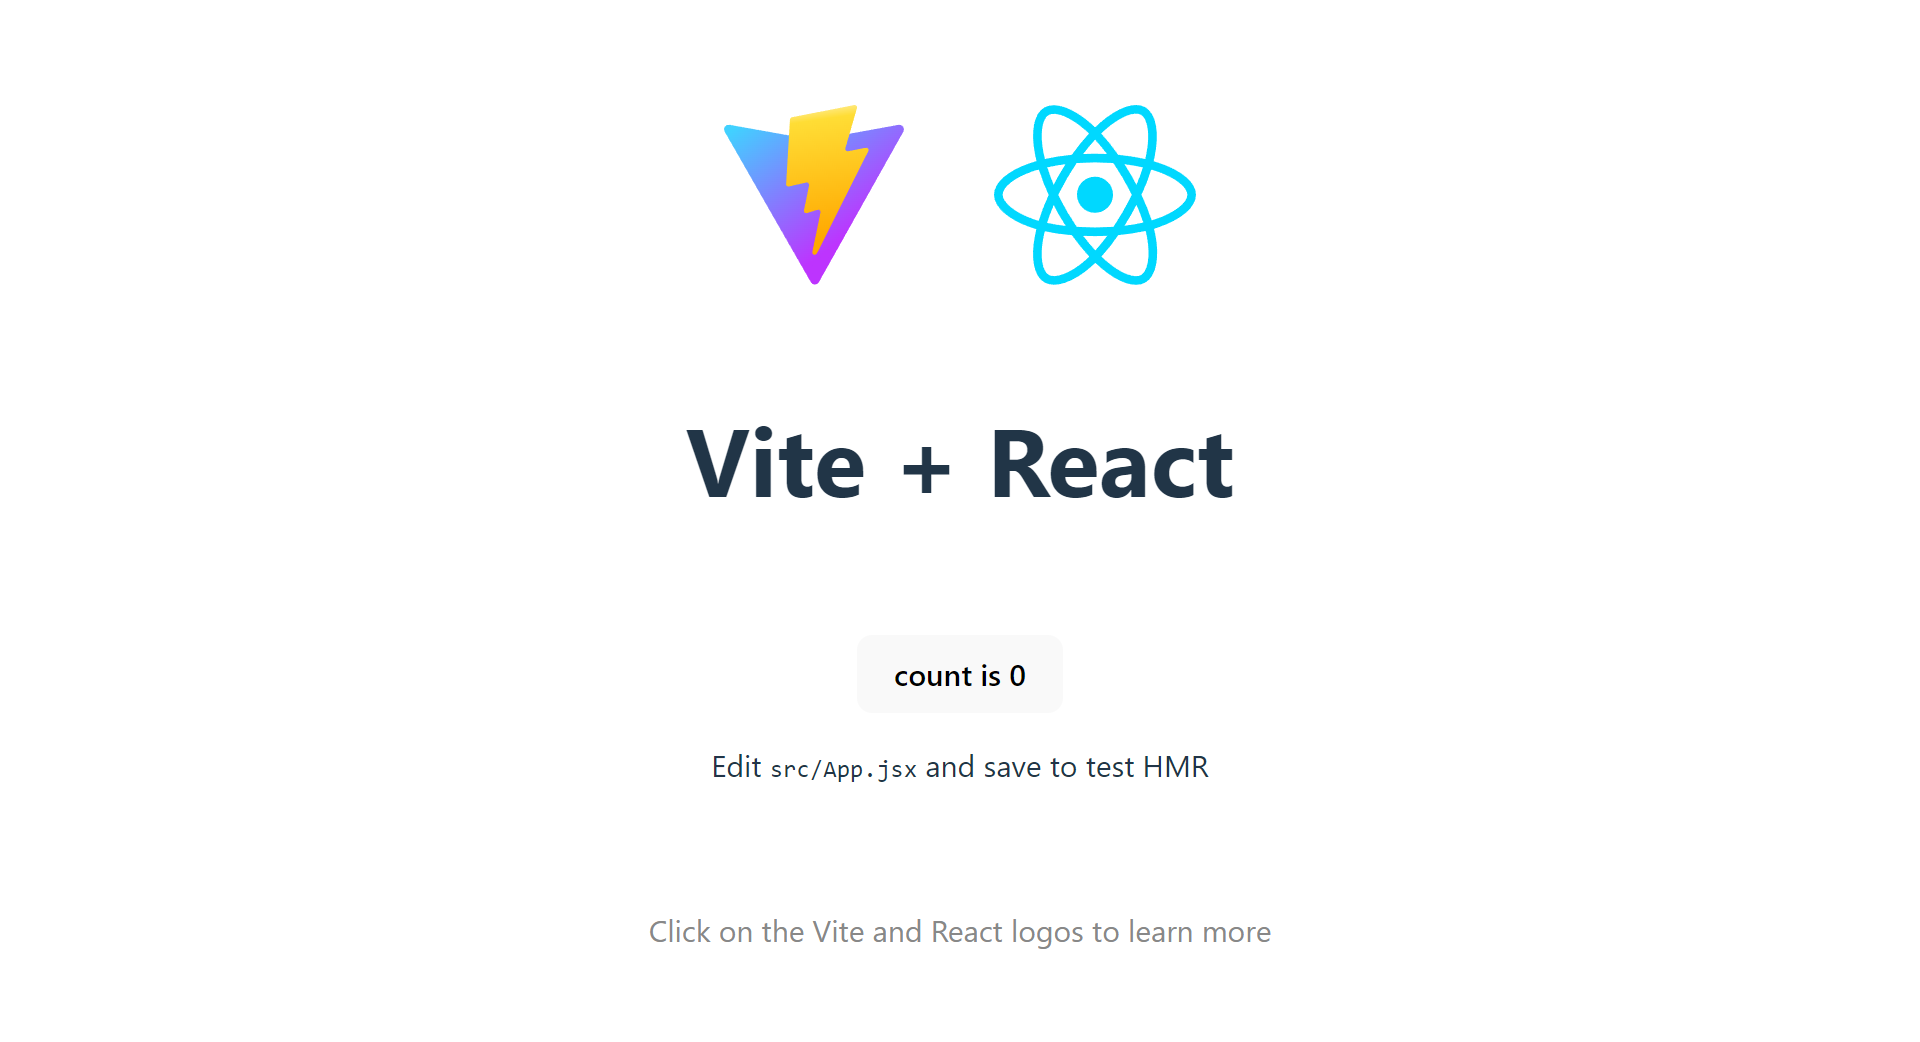
npm run dev - (STOP 1) Compruebe el resultado en el navegador.
- Revise el resultado en http://localhost:5173/

- Versiona local y remotamente el repositorio.
Estructura de archivos del proyecto en Vite - React.
- Archivos de configuración
- ./vite.config.js contiene la información al ejecutar el servidor de Vite.
- ./package.json contiene la lista de los paquetes instalados
- Código fuente
- ./index.html página de inicio
- src/index.css estilo global de la página
- src/main.tsx punto de entrada de la página
- src/App.tsx función componente principal
- src/App.css estilo de la función componente principal
React MUI: Instalación
-
Desde la línea de comandos, instale React MUI con:
npm install @mui/material @emotion/react @emotion/styled
React MUI: Componente Grid version 2
-
En el componente App.tsx, agregue la referencia al componente Grid 2.
import { ... } from 'react' // Grid version 2 import Grid from '@mui/material/Grid2' -
En App.tsx, reemplace el contenido a renderizar en el return por:
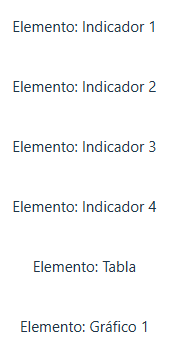
... function App() { ... return ( <Grid> {/* Indicadores */} <Grid>Elemento: Indicador 1</Grid> <Grid>Elemento: Indicador 2</Grid> <Grid>Elemento: Indicador 3</Grid> <Grid>Elemento: Indicador 4</Grid> {/* Tabla */} <Grid>Elemento: Tabla</Grid> {/* Gráfico */} <Grid>Elemento: Gráfico 1</Grid> </Grid> ) } export default App - Versiona local y remotamente el repositorio.
- (STOP 2) Compruebe el resultado en el navegador.
React MUI: Propiedades (Props)
-
En App.tsx, aplique al elemento Grid contenedor:
- El atributo container para convertir una cuadrícula fluida.
- El atributo spacing para crear un espaciado.
return ( <Grid container spacing={5}> {/* Indicadores */} <Grid>Elemento: Indicador 1</Grid> ... {/* Gráfico */} <Grid>Elemento: Gráfico 1</Grid> </Grid> ) - Versiona local y remotamente el repositorio.
- (STOP 3) Compruebe el resultado en el navegador.
React MUI: Layout
-
En App.tsx, aplique a todos los elementos Grid descendientes (con los textos del 1 al 6) los puntos de interrupción (atributo size) con las claves predeterminadas y valores de acuerdo con la siguiente tabla:
Diseño con puntos de interrupción Clave (Tamaño) Cantidad de columnas Elemento xs (extra-small) 12 Indicadores, Tabla y Gráficos xl (extra-large) 3 Indicadores 8 Tabla 4 Gráfico Haga click aquí para ver la soluciónreturn ( <Grid container spacing={5}> {/* Indicadores */} <Grid size={{ xs: 12, xl: 3 }}>Elemento: Indicador 1</Grid> <Grid size={{ xs: 12, xl: 3 }}>Elemento: Indicador 2</Grid> <Grid size={{ xs: 12, xl: 3 }}>Elemento: Indicador 3</Grid> <Grid size={{ xs: 12, xl: 3 }}>Elemento: Indicador 4</Grid> {/* Tabla */} <Grid size={{ xs: 12, xl: 8 }}>Elemento: Tabla</Grid> {/* Gráfico */} <Grid size={{ xs: 12, xl: 4 }}>Elemento: Gráfico 1</Grid> </Grid> ) - Versiona local y remotamente el repositorio.
- (STOP 4) Compruebe el resultado para los diferentes tamaños del navegador.


Configuración para el despliegue
- Desde la línea de comandos, acceda a la ruta del proyecto.
-
Instale el paquete
gh-pagesnpm install gh-pages --save-dev -
En el archivo
package.json- Agregue la entrada homepage en el formato:
https://{username}.github.io/dashboard:
{ ... "homepage": "https://{username}.github.io/dashboard", "type": "...", "scripts": { ... } }- Agregue los comandos predeploy y deploy a la entrada scripts:
{ ... "type": "...", "scripts": { ... "predeploy": "npm run build", "deploy": "gh-pages -d dist", ... } } - Agregue la entrada homepage en el formato:
-
En el archivo
vite.config.jsagregue la ruta al repositorio remoto/dashboard:export default defineConfig({ base: "/dashboard", plugins: [react()], }) - Versiona local y remotamente el repositorio.
- Desde la línea de comandos, ejecute el comando de transpilación y despliegue del sitio web, con:
npm run deploy- De ser necesario, elimine, corrija o comente las secciones de código identificadas por el transpilador.
- Vuelva a ejecutar el comando de transpilación y despliegue.
Documentación
- En react.dev se encuentra la documentación, tutoriales, playground y referencias para crear interfaces de sitios web y aplicaciones nativas.
- En vitejs.dev se encuentra la documentación y referencias que provee de un servidor de desarrollo local que se utiliza para crear aplicaciones web de JavaScript. Vite es conocido por su velocidad, facilidad de uso y soporte para una amplia gama de marcos y bibliotecas de JavaScript.
- En mui.com se encuentra la documentación de la librería de componentes visuales para React.
Fundamental
- React.dev Blog
Join us for a tour around the new site in our introductory blog post. You’ll learn what’s new, how to access the old site (in case you need it), and what’s coming next. https://t.co/h6K8uMyRXN
— React (@reactjs) March 16, 2023
- MUI is more than just Material UI!
🗣️💬 Shout it from the rooftops:
— MUI org (@MUI_hq) April 26, 2023
MUI is more than just Material UI! ✨
Headless components?
✅ Base UI
Next-gen design & DX?
✅ Joy UI
Advanced components?
✅ MUI X Data Grid & Date Pickers
Low-code admin builder?
✅ MUI Toolpad
Learn more here:https://t.co/ZulMd41oIf
Términos
librería, ui, ui material
Referencias
- Quick Start. (n.d.). Retrieved from https://react.dev/learn
- Vite. (n.d.). Retrieved from https://vitejs.dev/
- Cómo iniciar un proyecto React con Vite. (2022). Retrieved from https://carlosazaustre.es/react-vite
- Shamloo, R. (2023). Deploying Vite / React App to GitHub Pages. Retrieved from https://dev.to/rashidshamloo/deploying-vite-react-app-to-github-pages-35hf
- The React component library you always wanted. (n.d.). Retrieved from https://mui.com/
- Khaled, A. (2024). TypeScript vs. TypeScript SWC in Vite: Understanding the Differences. Retrieved from https://medium.com/@amirakhaled2027/typescript-vs-typescript-swc-in-vite-understanding-the-differences-7240e7309ca7
- Gitname. (n.d.). gitname/react-gh-pages: Deploying a React App (created using create-react-app) to GitHub Pages. Retrieved from https://github.com/gitname/react-gh-pages